
Viewing Engagement Statistics
Elementari provides detailed engagement statistics to help teachers track student progress and engagement with their projects. Here's how to view these statistics:
Viewing Lesson Engagement Statistics
- Access the Lesson Page: Navigate to the specific lesson page where you want to view engagement statistics.
- Lesson Stats Overview: On the lesson page, you'll find an overview of total character count, time spent writing, time spent coding, and total reads for the entire lesson.
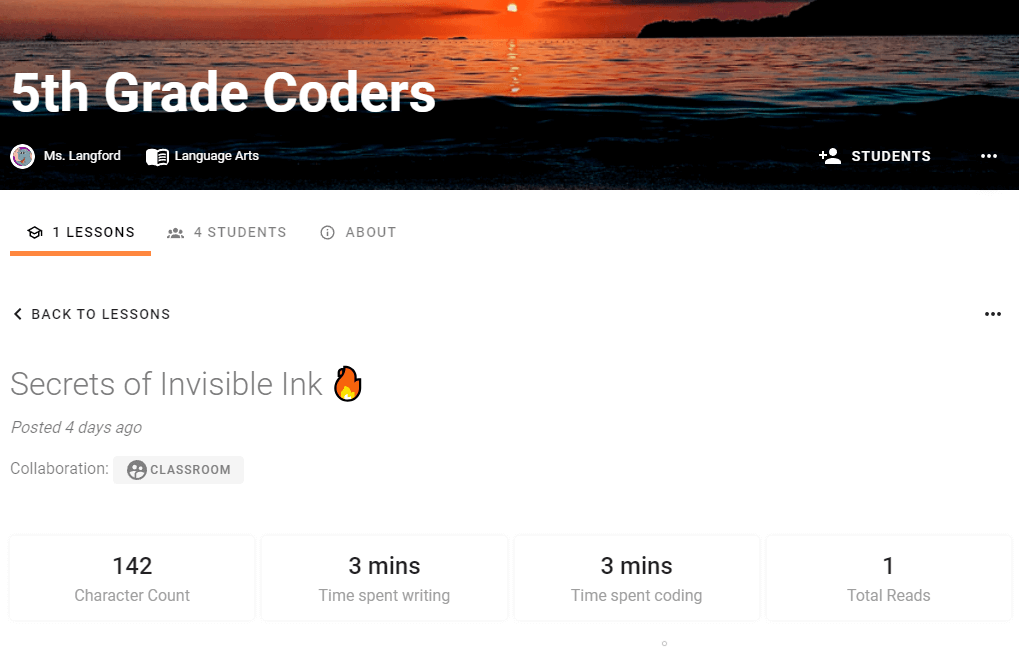
Screenshot of the lesson page showing engagement statistics.
Viewing Story Engagement Statistics
- Navigate to the Student Project: On the lesson page, you will see a project card for each student project.
- Story Card Stats: The project card displays key figures:
- Total Time Spent: Shows the total time spent on the project.
- Last Session Time: Displays time spent in the last session (shown in parentheses).
- Feedback Status: Indicates the status of feedback with color-coded labels:
- Green: Every feedback has been validated.
- Red: Corrections to validate.
- Yellow: Waiting for student corrections.
- Black: No feedback given yet.
- Progress Bar: The green bar at the bottom shows the student's progress through the project according to the lesson plan.
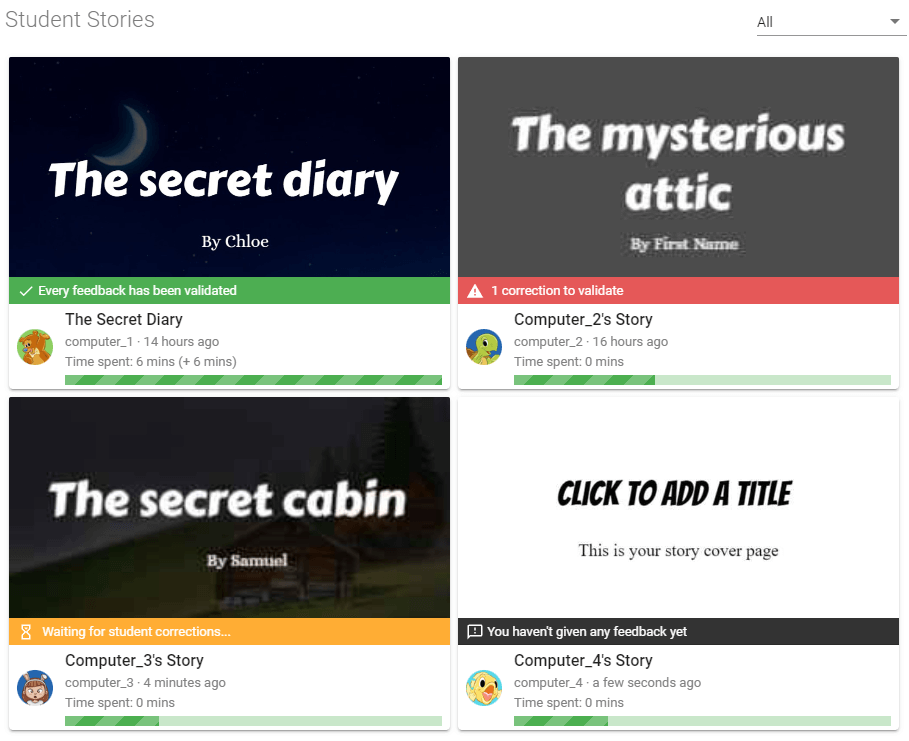
Screenshot of student project cards showing engagement statistics and feedback status.
Tips for Using Engagement Statistics
- Monitor Progress: Use these statistics to monitor student progress and identify areas where students may need additional support.
- Encourage Engagement: Share statistics with students to encourage participation and highlight their achievements.
Viewing engagement statistics helps ensure that students are actively participating and progressing in their projects.
For more details, visit our Quick Classroom Getting Started Guide.